Dollar-Cost Averaging, Explained: A Schedule, Not a Forecast
Dollar-cost averaging means investing the same amount on the same schedule whatever the price, so each purchase buys more when prices are low and less when they are high. It does not beat a lump sum most of the time, and it does not prevent losses. What it does is replace a single, consequential timing decision with a rule an investor can actually keep.
10 min read
Dollar-cost averaging is the practice of investing a fixed amount of money at regular intervals, regardless of what the market is doing on the day the money goes in. The amount stays the same, the calendar does the deciding, and the number of shares each purchase buys floats with the price. The Securities and Exchange Commission’s investor education site, Investor.gov, puts the mechanism plainly: by making regular investments with the same amount each time, an investor buys more of an investment when its price is low and less when its price is high. That is the whole technique. There is no forecast inside it, no view on valuation, and no claim about where prices go next.
That modesty is the point, and it is also the source of most of the confusion around the method. Dollar-cost averaging is frequently sold as a way to earn more. The record says it is a way to decide less. For an investor contributing from each paycheck, there is rarely a real alternative: the money arrives in pieces, so it is invested in pieces. For an investor who already holds cash and chooses to feed it in over months, the choice is genuine, and the arithmetic usually favors putting the money to work at once. Both uses share a name, but they are not the same decision. Readers following prices on Market Briefer’s Today board will recognize the temptation the schedule removes: the sense that today’s move demands a response.
The method is already the default for many investors, whether they use the term or not. FINRA, the brokerage regulator, notes that anyone contributing to a 401(k) or another employer-sponsored defined contribution plan is likely already dollar-cost averaging, because contributions from each paycheck are allocated on a fixed schedule regardless of what the market is doing. No one in that arrangement is timing anything. The contribution rate was set once, the payday repeats, and the purchases follow. Investing money as it is earned is not a strategy for beating an alternative; there is no pile of cash sitting idle while the schedule runs. The opportunity-cost argument against averaging, FINRA says, does not apply in that setting, since the funds are invested as they arrive. The criticism has force only where cash is deliberately kept on the sideline.
The arithmetic that does the work
The one mechanical advantage averaging genuinely delivers is visible in a single calculation, and it is smaller and more conditional than its reputation suggests. Because each purchase spends the same number of dollars, the average cost per share is not the simple average of the prices paid. It is pulled toward the lower prices, because the lower prices are where the fixed amount bought the most shares. In technical terms the average cost is the harmonic mean of the purchase prices, which sits at or below their arithmetic mean when there are no fees. That sentence is often presented as if it were a source of profit. It is not. It is a description of weighting. Whether the weighting helps depends entirely on what prices do after the purchases, and a worked example using real prices shows both halves of that statement at once.
Take the first half of 2022, a period no investor had to imagine, because the S&P 500 spent it falling. Suppose an investor put $1,000 into an index position at each month-end from January through June, using hypothetical fractional index units priced at each month’s closing index level, with dividends, fees and taxes set aside, solely to illustrate the averaging arithmetic. The index is the right vehicle for the illustration, since understanding what a stock index tracks is what makes a price in points usable as a purchase price at all. The closing levels were 4,515.55 on January 31, 4,373.94 on February 28, 4,530.41 on March 31, 4,131.93 on April 29, 4,132.15 on May 31 and 3,785.38 on June 30.
| Purchase | S&P 500 close | Amount invested | Units bought |
|---|---|---|---|
| Jan 31, 2022 | 4,515.55 | $1,000 | 0.2215 |
| Feb 28, 2022 | 4,373.94 | $1,000 | 0.2286 |
| Mar 31, 2022 | 4,530.41 | $1,000 | 0.2207 |
| Apr 29, 2022 | 4,131.93 | $1,000 | 0.2420 |
| May 31, 2022 | 4,132.15 | $1,000 | 0.2420 |
| Jun 30, 2022 | 3,785.38 | $1,000 | 0.2642 |
| Total | — | $6,000 | 1.4190 |
The division behind each row is the entire method: $1,000 divided by 4,515.55 is 0.2215 units in January, while the same $1,000 divided by 3,785.38 is 0.2642 units in June, about 19 percent more for the same money. Add the units and the position holds 1.4190 of them for $6,000, so the average cost is $6,000 divided by 1.4190, or $4,228.30 a unit. The simple average of the six closing prices is $4,244.89. Averaging therefore bought about $16.59 a unit below the average price, a gap of roughly 0.4 percent. That gap is real, it is automatic, and it is modest. Anyone expecting the harmonic-mean effect to transform an outcome needs to look at the next line of the calculation.
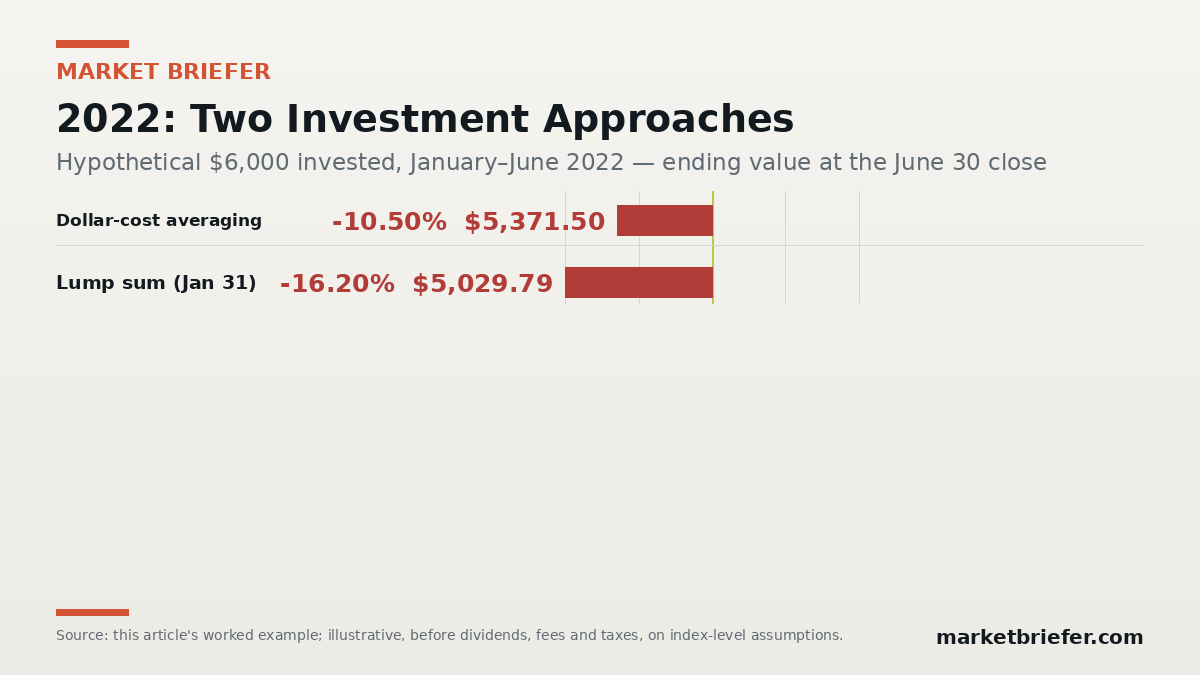
At the June 30 close of 3,785.38, the averaged position was worth 1.4190 times 3,785.38, or $5,371.50. The investor had put in $6,000 and was down $628.50, a loss of 10.5 percent, despite having bought below the average price. Averaging into a falling market still loses money while the market is falling; it simply loses less than the obvious alternative in this window. Putting the full $6,000 in on January 31 at 4,515.55 would have bought 1.3287 units, worth $5,029.79 on June 30, a loss of 16.2 percent. The schedule cushioned the decline by about $342 because four of its six purchases came after prices had already fallen, and the largest purchase in unit terms came at the lowest price. It did not protect the capital, it did not predict the June low, and had prices kept falling through the autumn, as they in fact did into October 2022, the averaged investor would have kept buying into that decline on schedule, for better or worse depending on the recovery that followed. The example earns its keep precisely because the result is unglamorous: a smaller loss, honestly arrived at, in a market where every entry point in the window was, for a time, wrong.
What history shows when the comparison is honest
Tested across long stretches of history rather than a single bad half-year, the lump sum usually wins, and the reason is arithmetic rather than character. Markets rise more often than they fall over the periods investors actually hold, so money that waits in cash is, on average, money that misses part of that rise. Vanguard examined the question directly in February 2023 in a paper by Megan Finlay and Josef Zorn titled “Cost averaging: Invest now or temporarily hold your cash?” Using MSCI World Index data from 1976 through 2022, Vanguard found that investing a lump sum immediately beat a three-month cost-averaging schedule 68 percent of the time for a global all-stock portfolio. At the median outcome on a $100,000 investment measured after one year, the lump sum ended at $111,940 against $109,580 for the three-month schedule, a difference of $2,360 in the lump sum’s favor. The pattern was not a quirk of one market or one mix of stocks and bonds, and stretching the averaging schedule made it worse rather than better, because a longer schedule holds more cash out of the market for longer. Vanguard’s earlier 2012 paper made the same point in its title alone: dollar-cost averaging just means taking risk later.
Two qualifications keep that finding from hardening into a slogan. The first is that the lump sum’s advantage is an average across many periods, and averages conceal the periods investors remember. In the roughly one-third of windows where averaging won, it won for the reason the 2022 example shows: prices fell after the first purchase, and later purchases bought more at lower levels. An investor who deployed everything at the S&P 500’s closing high of 1,565.15 on October 9, 2007 lived through a fall to 676.53 on March 9, 2009, a decline of 56.8 percent, and the index did not close above that 2007 high again until March 28, 2013. No average across 47 years describes what that specific entry point felt like or how it tested an investor’s willingness to stay invested at all. The second qualification is the comparison Vanguard ran against doing nothing. Cost averaging beat simply holding cash 69 percent of the time in its analysis, and U.S. stocks beat cash 76 percent of the time from 1976 to 2022. The practical contest for a hesitant investor is seldom between the theoretically best entry and a staged one. It is between a staged entry that happens and an ideal entry that is postponed indefinitely while cash waits for a clearer signal that rarely announces itself. A plan that gets money invested on a schedule it can sustain can be worth more than a superior plan abandoned at the first decline, which is the behavioral core of the case for boring investing and the reason the long, dull compounding visible on a compound interest calculator depends less on the first purchase than on the purchases still being made years later.
Where this breaks down
Averaging fails, first, when it is applied to the wrong asset and asked to do work no schedule can do. Averaging into a broad index is a decision about entry timing; the underlying exposure is diversified across hundreds of companies. Averaging into a single troubled company is a different act, because the schedule keeps committing money on the assumption that a lower price means a better bargain, when it may instead mean a business in genuine decline. A falling average cost is no comfort if the final price is near zero, and no purchase timetable repairs a broken balance sheet. That distinction is the same one that governs why diversification can fail when it is only apparent: spreading purchases across time is not the same as spreading risk across assets, and an investor who averages patiently into one name has diversified the calendar and nothing else. FINRA’s warning on the method is correspondingly plain. Averaging does not assure a profit and does not protect against loss in declining markets, and an investor using it should be ready to keep buying through a decline, which means holding enough cash reserve outside the plan to avoid being forced to stop it at exactly the moment its logic depends on continuing.
It breaks down, second, when the schedule itself becomes a disguised form of market timing. Extending a three-month plan to twelve months, then pausing it because prices look high, then restarting it after a fall, reassembles all the discretionary decisions the schedule was meant to eliminate, while keeping the cash drag that is the method’s one clear cost. Vanguard’s results on longer schedules quantify that drag: the longer cash waits, the more often the immediate investment finishes ahead. Fees compound the problem in a smaller way. A fixed commission or a wide bid-ask spread charged on every small purchase weighs far more heavily on twelve purchases of $250 than on one purchase of $3,000, and fractional-share pricing and spreads are real costs even where a platform advertises commission-free trading. The harmonic-mean advantage in the 2022 example was 0.4 percent before costs; a schedule with expensive purchases could hand that back and more without any change in market prices. Taxes require the same unsentimental accounting, since each purchase creates its own holding period and its own lot, which complicates later sales even though it can also give an investor more specific lots to choose among.
What remains is a tool with a narrow and defensible job. Dollar-cost averaging turns an intimidating single decision into a series of small, pre-committed ones. It lowers the cost of having been early to a decline, raises the cost of having been early to a rally, and trades some expected return, in the case of a deliberate windfall, for a higher chance that the investor follows the plan through. For money arriving paycheck by paycheck, it is not really a choice at all; it is simply investing, organized. For money already in hand, it is insurance against regret, priced in forgone return, and like most insurance it looks wasteful when nothing goes wrong. The investor who pays that price knowingly, for a schedule measured in months rather than years, is using the method as it should be used. The investor who believes the schedule will manufacture returns, protect capital, or rescue a poor asset is asking a calendar to do the work of judgment, and the calendar will decline.
Market commentary for informational purposes only, not investment advice.
See Market Briefer first in Google
Add to Preferred Sources